

NETWORK DEBUGGING GUIDE
How to Isolate Network Traffic Around a User Action
One click, a stream of network requests and WebSocket messages. Find the ones worth checking first.
A user clicks Save. An API request goes out, analytics records the click, and a background fetch refreshes account data. WebSocket messages, polling, and retries keep coming too. Some of that traffic has nothing to do with Save.
DevTools shows all of it. The harder question is: which network activity is most likely related to the action I just performed? That’s the question behind View Activity in PayloadPigeon.
VIDEO WALKTHROUGH
See network noise turn into a focused debugging view
Watch how one Submit action gets buried in HTTP and WebSocket traffic — then see how View Activity narrows the events worth checking first.
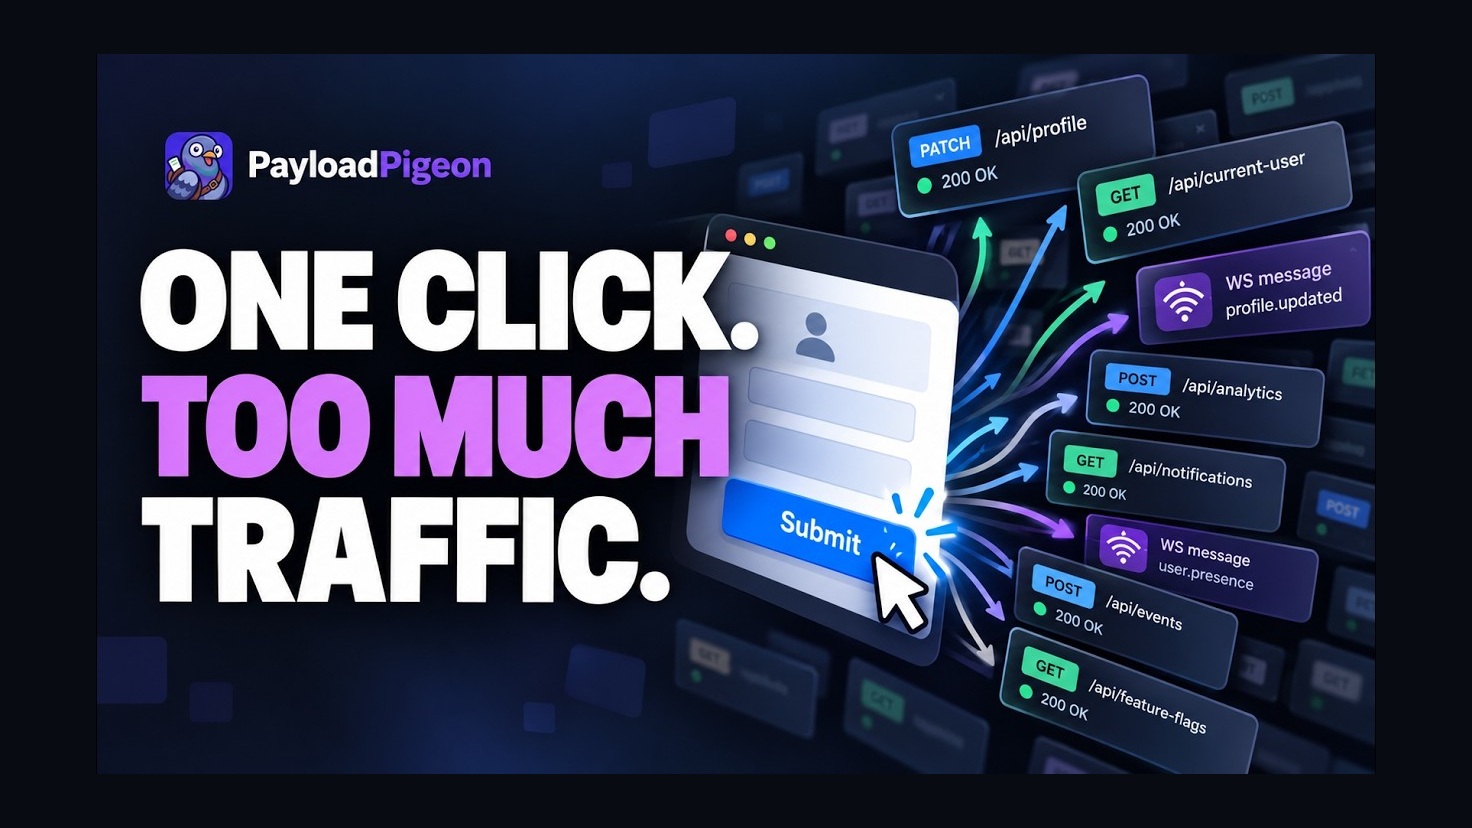
Debug network traffic around a user action with View Activity · PayloadPigeon
Selecting Play loads YouTube’s privacy-enhanced player. YouTube then receives your connection data. Privacy details.
Watch on YouTube ↗One click, multiple network events
Say you edit a profile and click Save. The application might send:
PATCH /api/profile
POST /analytics
GET /api/current-user
A little later, a WebSocket message arrives:
{
  "type": "profile.updated"
}
Meanwhile, background requests continue. Everything lands close together in the Network panel, even though it serves different purposes.
In a quiet application, you can usually pick out the interesting entries. In a busy one, you spend more time sorting through traffic than checking the feature. The useful question is simpler: what happened on the network around Save?
Why filtering network requests by URL is not always enough
If you know the save request uses /api/profile, filtering by /profile is a good start. You find the request, inspect its response, and check whether the data looks right.
But that request may be only one part of the flow:
Save
  ↓
PATCH /api/profile
  ↓
backend processes update
  ↓
WebSocket: profile.updated
  ↓
frontend updates UI
A URL filter helps you find a known request. It is less useful for answering “What else happened around this interaction?” A follow-up request might use another endpoint, and the WebSocket connection may carry updates for several unrelated features.
View Activity in PayloadPigeon
View Activity helps you narrow that search. Instead of repeatedly scanning all HTTP and WebSocket traffic, open the activity around the interaction and start with a smaller group of likely relevant events.
View Activity doesn’t prove that every event was caused by the interaction. It gives you a smaller set of likely candidates to investigate first. Asynchronous application work, background requests, polling, and delayed server events can make that relationship difficult to determine from the browser alone.
The practical benefit is still straightforward. If you can reduce 50 events to 5–10 plausible candidates, debugging is already much easier. Those numbers illustrate the idea; they are not a guaranteed reduction.
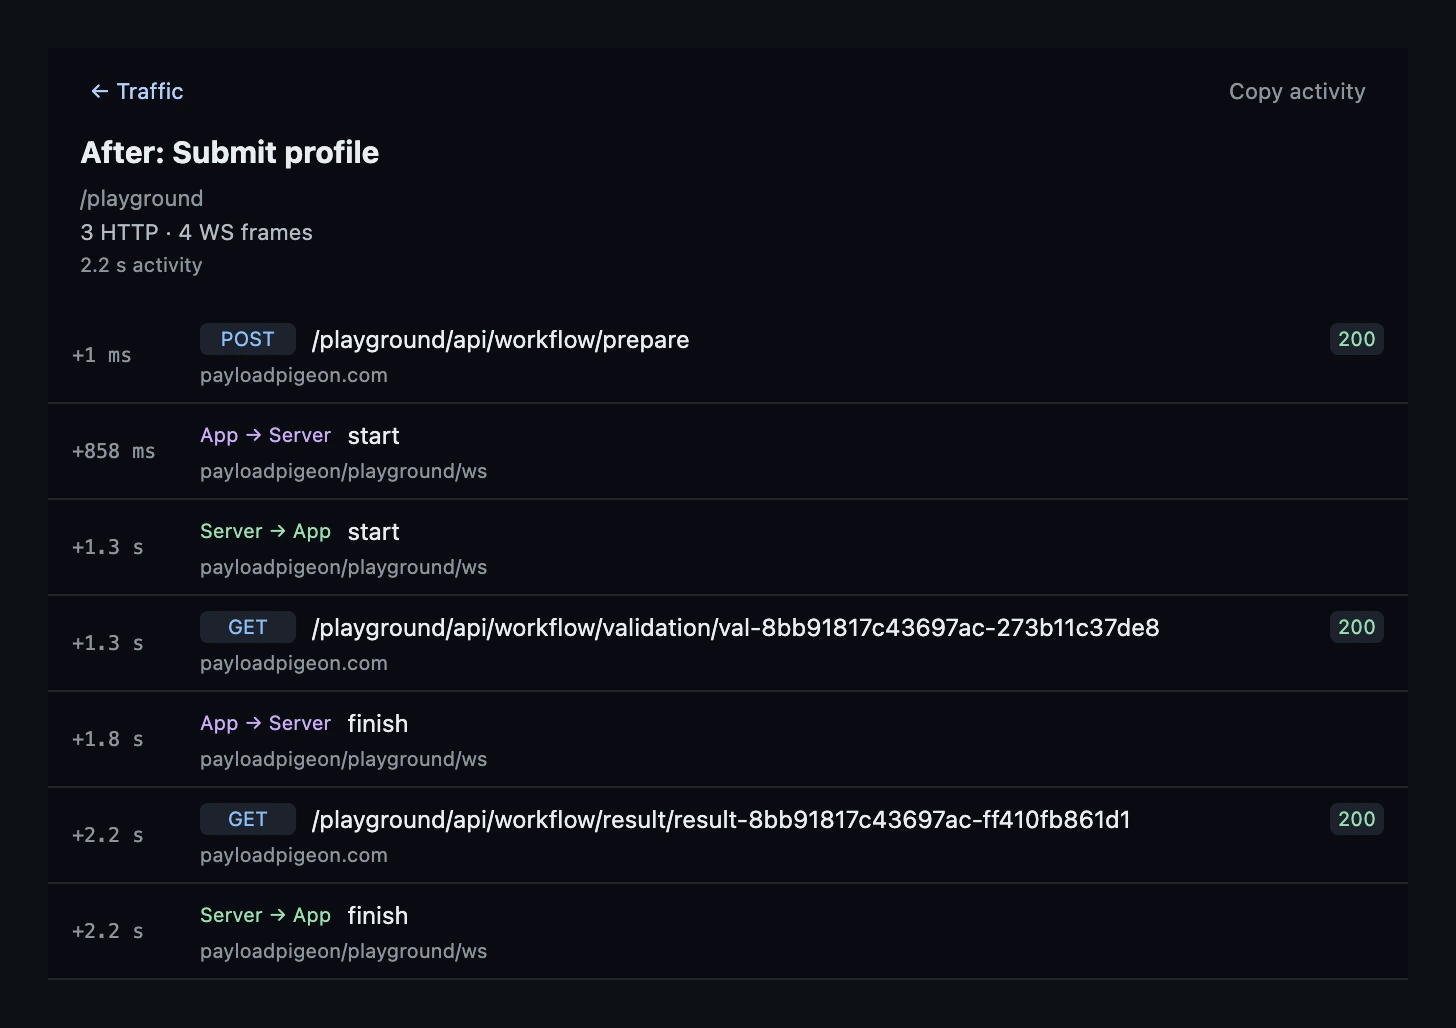
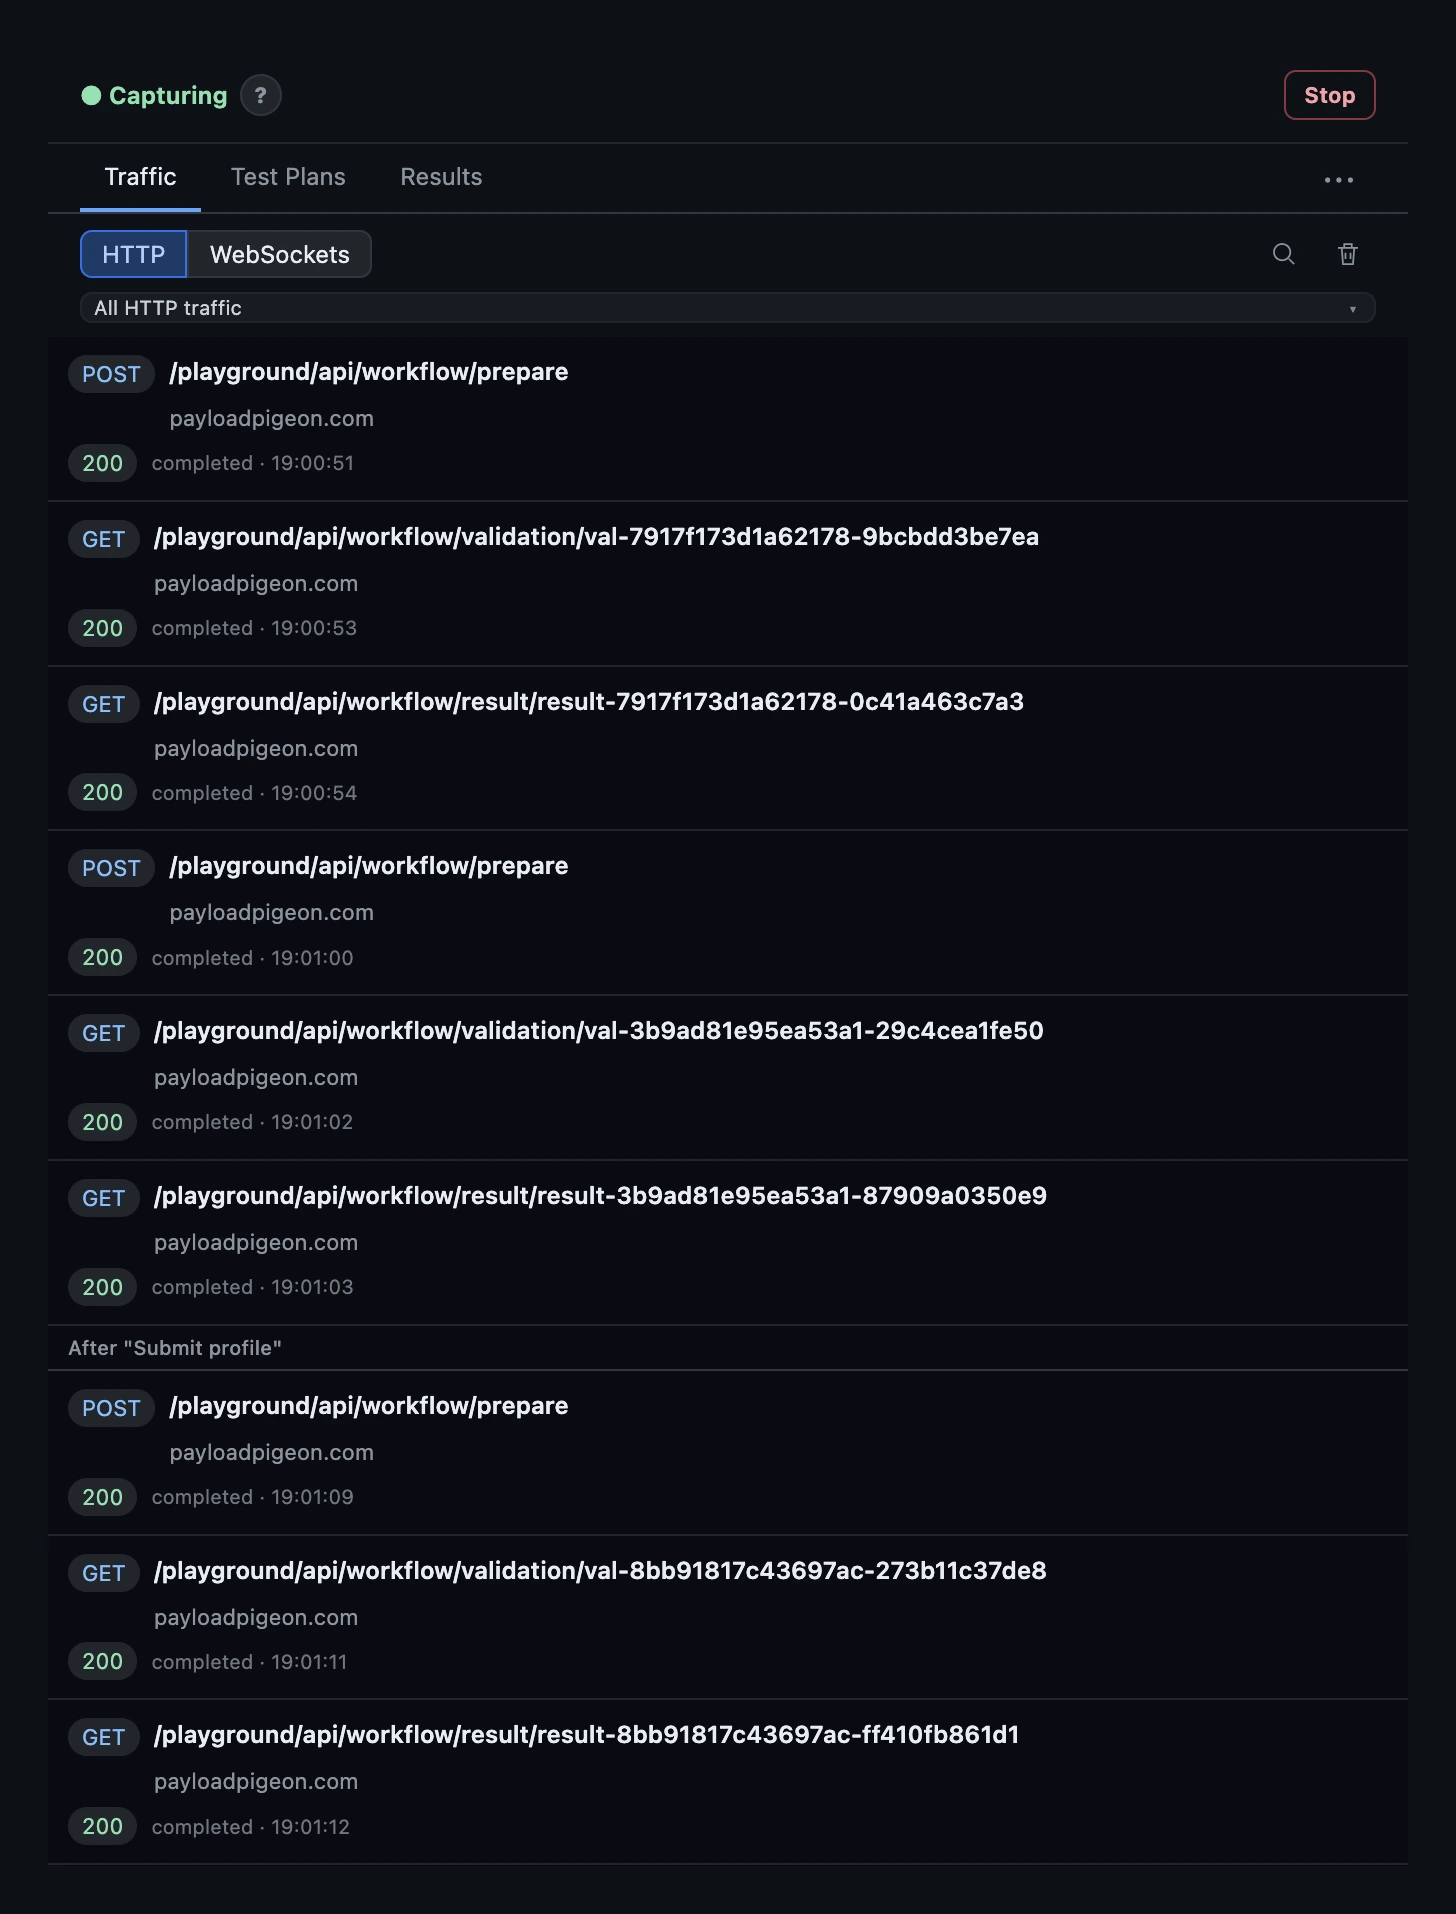
To try it, open the Workflow Playground, start Capture, and click Submit profile. Select After: Submit profile in Traffic, then View activity →. The screenshots show this repeatable Playground workflow; Save is the example we’re using to explain the debugging problem.
Note: Start Capture before the app opens a supported WebSocket connection if you want to modify its messages.
Why this is especially useful with HTTP + WebSocket
Saving data and showing the result are not always the same step:
User clicks Save
        ↓
HTTP request
        ↓
backend updates data
        ↓
WebSocket event
        ↓
frontend receives update
        ↓
UI changes
The HTTP request returns 200 OK, but the spinner keeps spinning. The frontend is waiting for this message:
{
  "type": "settings.updated"
}
It never arrives, so the page never leaves its waiting state. Looking only at the successful HTTP response misses the problem.
Sometimes the useful clue is not what happened, but what did not happen. Seeing HTTP requests and realtime messages together makes it easier to spot the gap between saving the data and updating the screen.
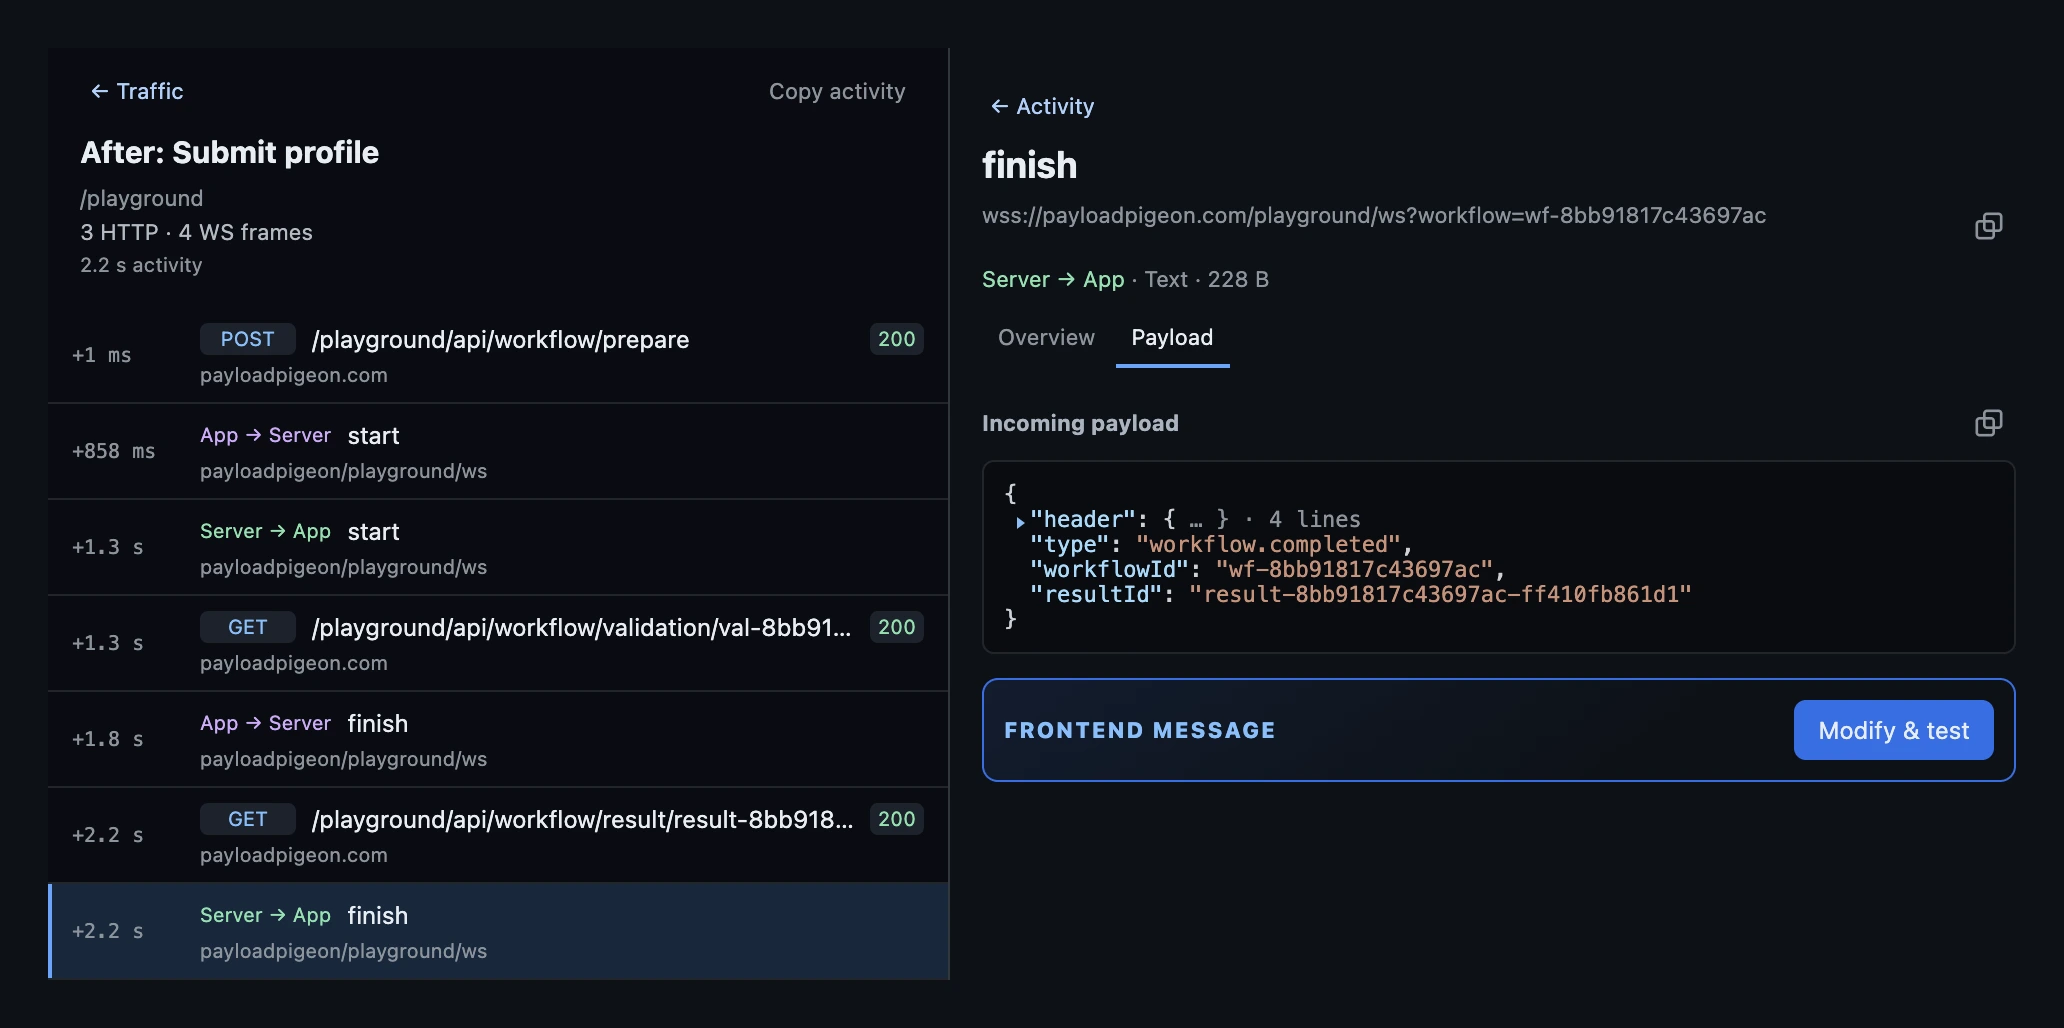
Before treating a message as missing, check the wider Traffic history and active filters. It may have arrived later or outside the selected activity. Compare with a working run: which update normally follows the response, and what does the frontend do with it?
A better hypothesis, not perfect causality
Usually, you want a few practical answers:
- Which request went out, and what response came back?
- Did the expected WebSocket event arrive?
- Were there unexpected requests?
- In what order did things happen?
You don’t need a perfect dependency graph to choose the next check. A successful save followed by no update suggests a different investigation from a failed request or an update containing the wrong record ID.
Reduce the network noise and build a better debugging hypothesis. That is the point of starting from the interaction.
What to do after finding the relevant traffic
Once you find a likely request or message, inspect its payload, headers, response, timing, and place in the sequence. Look for missing messages and unexpected values.
Then change one condition: modify a payload, remove a field, delay or drop a supported message, or replay a request or message where supported. That lets you check a rare frontend state without waiting for it to happen naturally.
User interaction
      ↓
View Activity
      ↓
Likely relevant HTTP / WebSocket traffic
      ↓
Inspect
      ↓
Modify / replay / test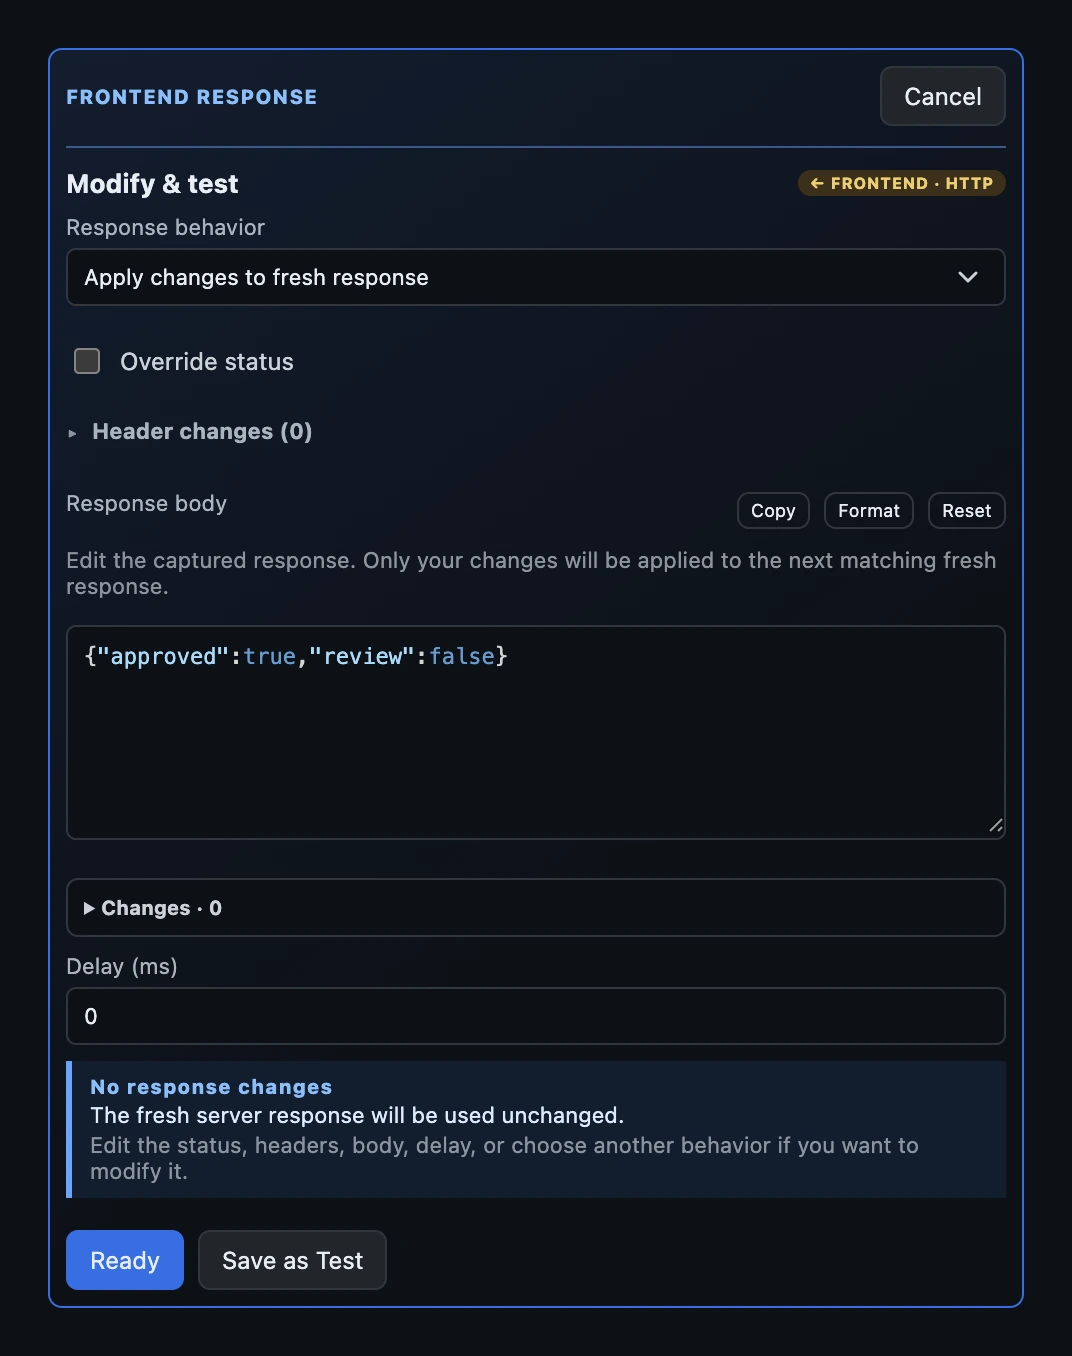
The WebSocket testing guide covers message modification, delay, drop, and sending. If a check is worth repeating, save it as a Test. The manual regression suite guide explains how to keep useful scenarios and record what happened when you ran them.
Where the boundary is
If you need to trace an exact chain across frontend code, backend services, queues, databases, and realtime events, browser-level observation is not enough. That calls for correlation IDs, backend telemetry, and distributed tracing with tools such as OpenTelemetry.
View Activity solves the browser-side problem: cut through network noise and find the useful context faster.
Debug the interaction, not the whole network
When someone clicks one button, you rarely need every network event the application produces. You need context: what happened after the action? Which requests appeared? Which WebSocket messages arrived? What did not happen?
A small group of likely relevant events gives you a much better place to start.
Don’t debug the whole network. Debug the interaction.
Use View Activity in PayloadPigeon to narrow the HTTP and WebSocket traffic around the action you’re debugging. Try the Workflow Playground, or Add to Chrome to investigate your application.